For years eContent Pro® has been known for the highest quality and cost-efficient English language copy editing and translation services, and we are pleased to announce that new for 2019 we have added even more services to accommodate authors. In addition to the English language copy editing and translation services, we now offer scientific and scholarly editing, journal recommendation, typesetting and publishing, as well as figure, table, chart, and equation conversions. Each of these services is instrumental to ensuring the publication of the highest quality research work.
eContent Pro’s figure, table, chart, and equation conversions service can greatly enhance an author’s manuscript by improving the quality of all visual elements within the work and ensuring that the data is being accurately represented. Authors navigating through the publishing process understand the importance of including quality images to support their research findings. However, the lingo that tends to accompany visual elements, such as DPI, resolution, pixelation, rendering, exporting, cropping, and retouching can be very confusing and leave even the most seasoned author reeling. With the strong emphasis being placed on quality in academic publishing and the high selectivity of scholarly publications, authors are very often receiving feedback from editors, reviewers, and/or publishers telling them that their figure quality needs to be improved, their tables need to be resized, or their equations need to be converted to another format. Authors are finding themselves in just as much need of assistance in clarifying and enhancing visual elements within their work as they are in improving the body text/content. If they do not resolve these issues, very often, their work could be at risk of rejection and/or being pulled from a publication.
So, what can eContent Pro’s figure, table, chart, and equation conversions service offer to authors, and how can it specifically enhance the overall quality of your manuscript?
While going through the academic publishing process, many manuscripts either already have visual elements or are in need of visual elements to further support the work. As we are in a highly visual society, learning and scholarship is becoming increasingly hybridized, relying on a rich combination of words and images. Unfortunately, even when a manuscript includes visual elements such as figures, charts, and tables, the quality of the elements often does not meet the requirements of the publication or publisher. The leadership of the publication and/or the publisher will send the manuscript back in order to receive clearer images, and this can cause serious delays in the manuscript’s publication date or could cause the work to be rejected altogether. eContent Pro’s figure, table, chart, and equation conversions service improves the quality of visual elements in your manuscript and can aid the timeliness of the publishing process.
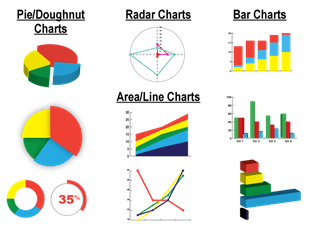
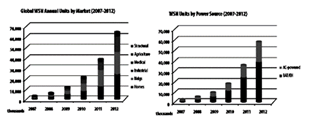
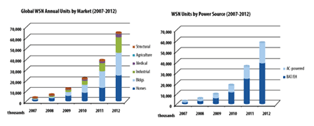
Example of chart enhancement:
Figure, Table, Chart, and Equation Conversions Service
eContent Pro’s design and math configuration experts can correct the following:
- Figure design, enhancement, and correction for clarity.
- Image editing, color correction, and sizing/resolution modifications.
- Raw data transformations into graphs, charts, and tables.
- Equation conversions to MathType or Microsoft’s Equation Editor.
- Presentation illustration including animation, slide-design services (in Microsoft PowerPoint), and poster design.
Visual elements are crucial to research projects as they add value to the overall work, allowing readers to better understand the data presented in the research, and can increase the professional appearance of the research. The figure, table, chart, and equation conversions service from eContent Pro® will help you meet the requirements that publications and/or publishing houses look for when examining visual elements within your work, such as DPI (dots per inch), clarity, and many other items that will make your images clearer and much better representations of your research.
See below for more examples of how eContent Pro’s figure, table, chart, and equation conversions service can improve visual elements.